Norelco Pulse Height Analyzer (1955-1956)
Although I know almost nothing about this Norelco (part of Philips Electronics, Inc.) Pulse Height Analyzer, it is still one of my favorite parts of the collection. Its attraction lies in its simplicity. Although it was only a single channel analyzer, it could accomplish the same thing as a sophisticated multichannel analyzer (MCA), i.e., measure the sizes of the pulses from a NaI detector so that a spectrum could be generated.


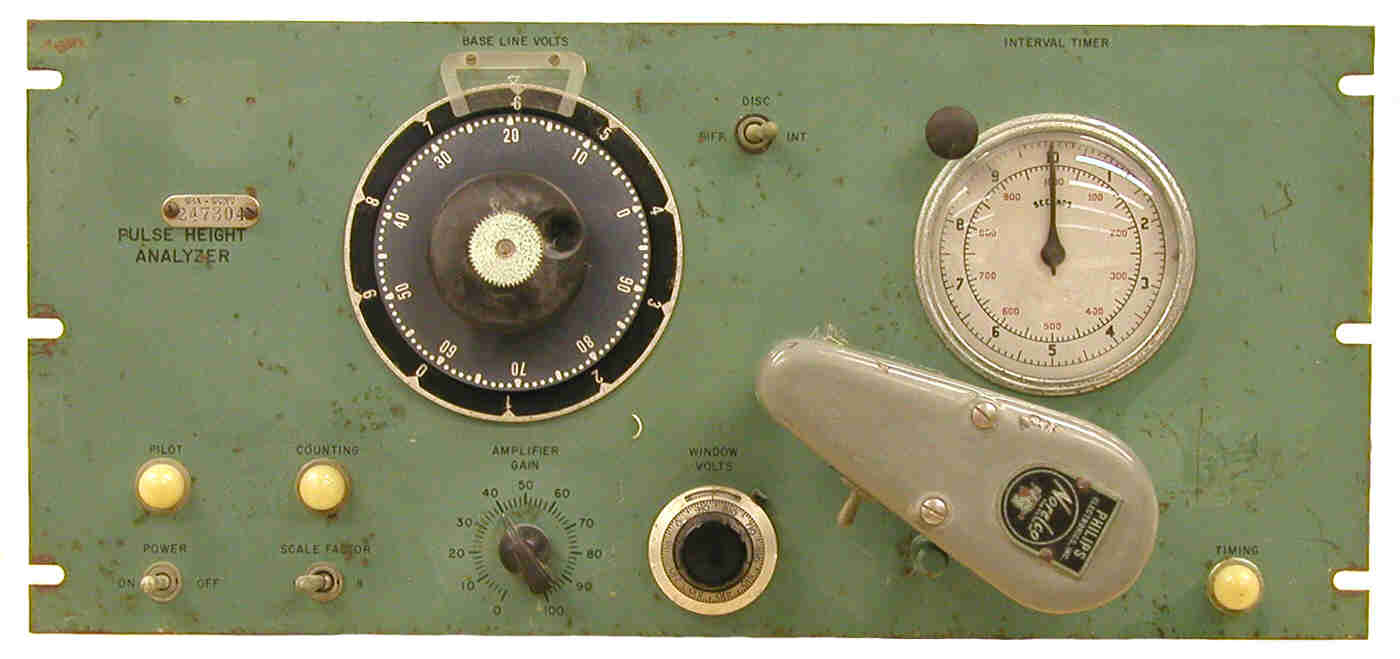
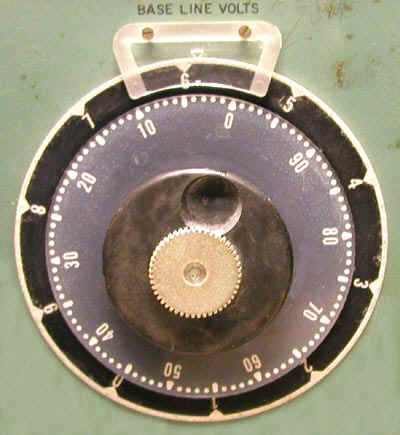
Signals from a sodium iodide detector were fed into the analyzer’s built-in amplifier. If the amplitudes of the output pulses from the amplifier fell within the system's adjustable energy window, they could be recorded or passed on to a ratemeter and strip chart recorder. The baseline threshold for the window (lower boundary of window) was adjusted from 0 to 10 volts with the large black dial seen in the photograph to the right. The window width was set with the silver and black multi-turn potentiometer located in the bottom center of the control panel (seen in the photograph above).
As an example of how an analysis might work, assume that the threshold is 0 volts, the window width is 1 volt, and the count time is 1 minute. During the count, pulses whose sizes fall between 0 and 1 volt would be recorded. For the next count, the threshold is increased to 1 volt. As such, the pulses between 1 and 2 volts in size are counted. This process is repeated until we have determined the number of pulses in all ten size ranges from 0 to10 volts. In effect, this equates to a ten channel MCA. To increase the number of size ranges the pulses are sorted into (channels), we simply reduce the width of the window.
The “gee whiz” aspect of this Norelco analyzer is that the window threshold could be raised automatically and continuously by a motor-driven gear at the end of the movable gray arm seen in the photograph. To do this, the arm was rotated counterclockwise until the gear contacted a similar gear attached to the control knob for the window threshold. When the motor is turned on via the toggle switch on the arm, the window threshold increased.
As this was going on, the analyzer's output went to a count rate meter and on to a strip chart recorder that “drew” the spectrum smoothly and continuously in real time. No digital signal processing here. Purely analog. This is how spectra were meant to be generated! In some labs the peaks on the spectrum were integrated by cutting them out with scissors and weighing them!
Size: 14” x 19” x 8.5”
We can assign a date to the analyzer by the Oak Ridge National Laboratory property tag. The latter is stamped with the letters "UCNC" which stand for Union Carbide Nuclear Company. The latter name was used from 1955 to 1956.
Donated by Paul Frame.
